The Markov Chain
Written by Elda Cervantes and Rithika Devarakonda
Markov’s chain is a great tool to find probabilities. We take an automaton in relation to a probability problem, which relates to propositional logic. They are useful when looking at how the present impacts the future without taking into account the past. In the modern world, Markov Chains are used by companies and organizations. This concept is useful in departments like weather forecasting or when creating marketing strategies. Markov’s chain is a real world application of finite automata like DFA’s. In this article, we will be focusing on a specific problem found in the article “Markov Chains in Python: Beginner Tutorial” written by Sejal Jaiswal.
As Sejal Jaiswal says, a Markov chain is “represented using a probabilistic automaton. The changes of state of the system are called transitions. The probabilities associated with various state changes are called transition probabilities. A probabilistic automaton includes the probability of a given transition into the transition function, turning it into a transition matrix.”

Our Problem
In our article, we are presented with an example of how to create a Markov Chain. Here is our presented case:
“When Cj is sad, which isn’t very usual: she either goes for a run, gobbles down ice cream, or takes a nap.”
In order to create a Markov Chain, we must first create a transitional matrix, which lists the probabilities of every state transition. In other words, our current state represents Cj’s actions the present day, while our next state represents Cj’s actions the next day. The probabilities of a state transition refers to the odds that Cj does one out of the three specific actions the current day and the next day. An example of a probability of a state transition is the likelihood that Cj goes for a run the current day and then takes a nap the next day. Thus, in order to fill in the associated probabilities with a state transition, we must create a transitional matrix that helps us create a Markov Chain, which describes a specific situation.
Our transition matrix is an N x N matrix assuming that N is the number of states we have. So first, we must identify the number of states in our problem. Since we are given three actions that Cj does when she is sad, we have 3 states. An important note we must consider is that we assume that Cj cannot do all 3 actions at the same time. In other words, Cj cannot both take a nap and eat ice cream at the same time, as the keyword in the problem statement is either. Now, this is a recurring theme among Markov Chain problems, as the idea is that there is only one current state and thus one transition to a single next state. This helps us keep track of our probabilities in a suitable manner.
As stated above, we isolated the 3 activities Cj does when she’s sad to identify our N value or in other words the number of states. Now, we must create a 3 x 3 transitional matrix of the probabilities associated with each situation.
Here is a step by step breakdown of our process when going through the creation of the transition matrix:
We have 3 states, as given in our problem:
- Cj goes for a run
- Cj eats ice cream
- Cj takes a nap
As a note, the article gave us all of the associated transitional probabilities in a matrix format, but we’ve provided the logical breakdown of the methodology the author used in the problem’s solution.
Assuming Cj is sad:
When the current state is Cj taking a nap:
- The next state is Cj taking a nap: There is a 20% chance that she takes a nap
- The next state is Cj going for a run: There is a 60% chance that she goes for a run
- The next state is Cj eating ice cream: There is a 20% chance that she eats ice cream

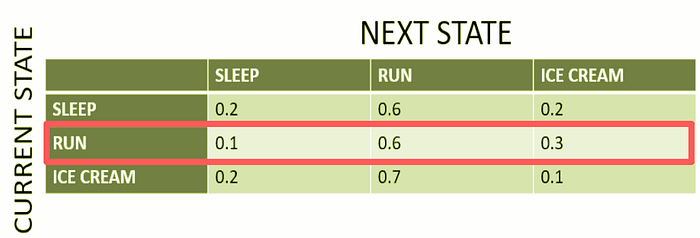
We highlighted in red the row we focused on, as the current state (as stated as in the row header on the left) is that Cj is taking a nap during the present day.

The columns represent the next state given that the current state is that Cj is taking a nap in the present day. As we stated earlier, you can see the associated probabilities with every transition, as when Cj takes a nap the current day the probability that the next day she either takes a nap is 0.2, she goes for a run is 0.6, or she eats ice cream is 0.2. The three different columns are highlighted in different colors to isolate the 3 difference probabilities of the state transitions.
When the current state is Cj going for a run:
- Next state is taking a nap: There is a 10% chance that she takes a nap
- Next state is going for a run: There is a 60% chance that she goes for a run
- Next state is eating ice cream: There is a 30% chance that she eats ice cream
We highlighted in red the row we focused on, as the current state (as stated as in the row header on the left) is that Cj is going on a run during the present day.
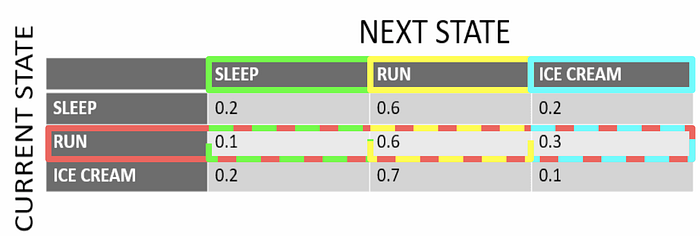
The columns represent the next state given that the current state is that Cj is going on a run in the present day. As we stated earlier, you can see the associated probabilities with every transition, as when Cj is going on a run the current day the probability that the next day she either takes a nap is 0.1, she goes for a run is 0.6, or she eats ice cream is 0.3. The three different columns are highlighted in different colors to isolate the 3 difference probabilities of the state transitions.
When the current state is Cj eating ice cream:
- Next state is taking a nap: There is a 20% chance that she takes a nap
- Next state is going for a run: There is a 70% chance that she goes for a run
- Next state is eating ice cream: There is a 10% chance that she eats ice cream
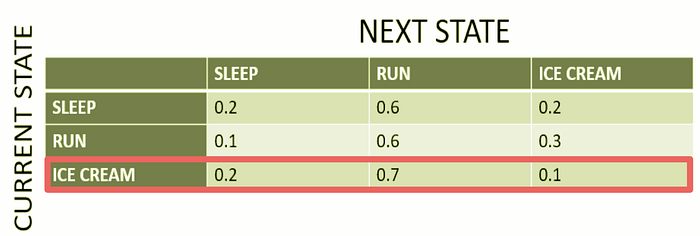
We highlighted in red the row we focused on, as the current state (as stated as in the row header on the left) is that Cj is eating ice cream during the present day.
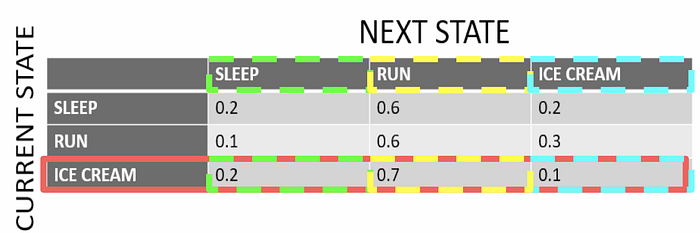
The columns represent the next state given that the current state is that Cj is eating ice cream in the present day. As we stated earlier, you can see the associated probabilities with every transition, as when Cj is eating ice cream the current day the probability that the next day she either takes a nap is 0.2, she goes for a run is 0.7, or eats ice cream is 0.1. The three different columns are highlighted in different colors to isolate the 3 difference probabilities of the state transitions.
Below is the final transitional matrix.

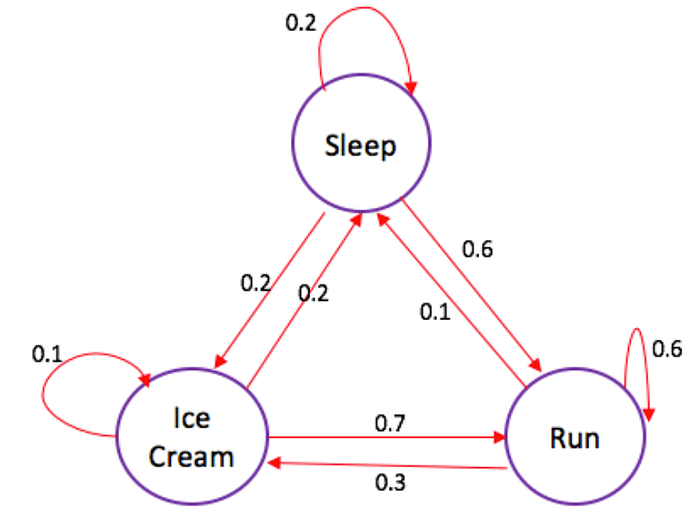
Using our final transitional matrix, we can create our Markov Chain. To create the Markov Chain, we label all of our 3 states with the situation they represent currently. We then create transitions between states. The direction of the arrow determines our current and next state, as the state that our arrow points toward is our next state. Thus, we continue to use the values in our matrix and plug the values accordingly into their associated state transition. When the current state is equal to the next state, it means that Cj does the same action during the current and next day. In that case, the arrow points or runs back towards our current state as there is no transition to a different state.
Additional Practice
Now let’s take another look at the Markov chain that models the weather that was presented to us in the beginning of this post.
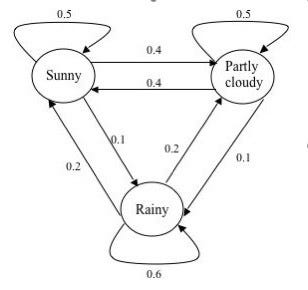
Now we want you to try to model our steps above, and try to create your own transitional matrix. When you are done, scroll down to see the final answer !
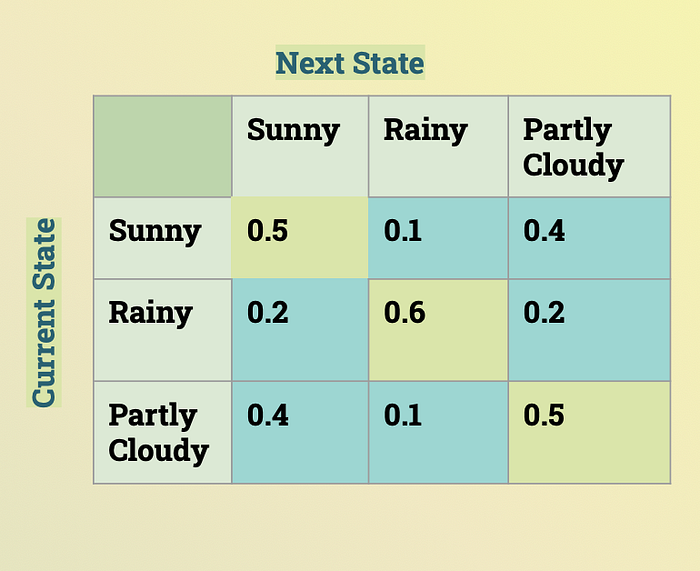
Final Transitional Matrix:
We created a transitional matrix of this Markov chain that models the weather below using the same process as listed above, but we instead worked backwards from the Markov Chain in order to recreate the associated transitional matrix.
Concluding Discussion
In our assessment, something that is still unclear is that we still are not sure where these probabilities come from. The probabilities in the problem regarding Cj’s behavior were given to us without an explanation for the math behind these probabilities. We would have liked to see how the author of our article came up with the probabilities and see the work that went into that. As you can see in the examples provided above, one could easily use a Markov Chain in weather forecasting as well as in marketing tactics perhaps to describe a consumer’s typical behavior. The Markov Chain is an application of probability and automata, which is something that businesses could definitely use in order to make difficult decisions, as one can see the various potential decisions broken down in an accessible and visually appealing way.
Contributions
Rithika did research and found both articles. She edited the images found in the article like the tables and highlighted different rows when explaining the steps. Rithika also wrote the transitional statements and walked us through the problem. She finished up the post by writing the conclusion. Elda worked on writing the introduction and applying Markov’s Chain to the real world. She also wrote the captions, and citations. Elda created the final Medium Post and put all the sections together. She also edited the writing.
Works Cited
Original Article:
Jaiswal, Sejal. “Markov Chains in Python : Beginner Tutorial.” Datacamp, https://www.datacamp.com/community/tutorials/markov-chains-python-tutorial.
Additional Resource:
Li, Bai. “Real World Applications of Automaton Theory.” Wordpress, https://luckytoilet.wordpress.com/2018/01/01/real-world-applications-of-automaton-theory/.